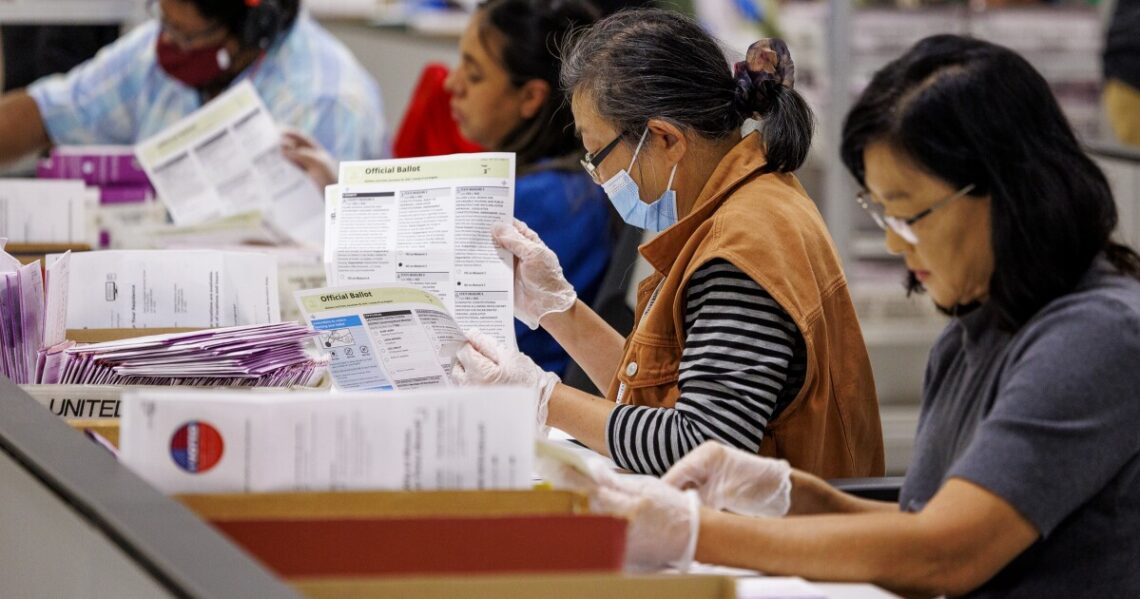
Election Day may be over, but officials are still counting ballots. We have the latest numbers on what the voter turnout looked like.
L.A. County turnout
As of Wednesday, Nov. 6, 2,615,541 cast votes have been counted in Los Angeles County. That represents a turnout of nearly 46% of the county’s 5,745,214 registered voters. The turnout percentage will continue to go up as more ballots are tallied in the coming days.
Here’s how the vote is breaking down so far:
- 64% voted by mail.
- 36% voted in person.
For reference: The 2022 general election, which had the L.A. mayor and California governor on the ballot, drew 2,456,701 L.A. County voters to the polls.
Typically, presidential election years draw larger turnouts (as you’ll see in the chart below.)
Has your 2024 general election ballot been tallied yet? You can track the status of your ballot here.
Turnout in recent L.A. elections
Note: The 2024 turnout will continue to rise as more ballots are tabulated.
Orange County turnout
In Orange County, as of Nov. 6, 1,179,940 votes have been counted. That represents a turnout of nearly 63% of the county’s 1,862,010 registered voters.
Here’s how the vote is breaking down so far:
- 73% voted by mail.
- 27% voted in person.
For reference: In the 2024 primary, turnout was around 38%, with about 685,038 of 1,818,551 registered voters casting ballots.
Has your ballot been tallied yet? You can track the status of your ballot here.
Turnout in recent Orange County elections
Note: The 2024 turnout will continue to rise as more ballots are tabulated.
Where things stand in the…
Read the full article here


