California’s 5.3% unemployment in February was the highest rate in the nation.
My trusty spreadsheet, looking at labor stats dating to 1976, could find only 11 other months the state reached this dubious ranking. Look to the early 1990s economic malaise (August to December 1994) and the coronavirus chill (March to August 2021).
That’s on top of our previous mention in this space that 2023 was the first year since 1994 that the state ranked dead last in the nation for job growth on a percentage-point basis.
To be fair, California historically has been the nation’s leading job creator. At the same time, it’s a reasonable bet that in any given month California will be high on the joblessness scorecard.
Consider that California unemployment has ranked second-highest amongst the states in 72 months over 48 years. It was third 52 times, fourth 35 times, and fifth 49 times.
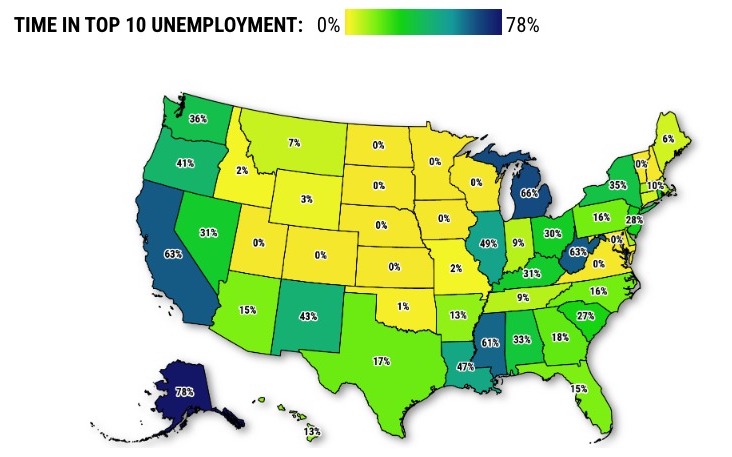
So an average month since 1976 has seen California unemployment ranked No. 10 among the states. Only five places fared worse – Alaska, the District of Columbia, West Virginia, Mississippi, and Michigan.
And by the way, here’s another example of California’s persistent high joblessness: Its best month in the unemployment rankings since 1976 was 29th best in October 1987.
Yes, the best ranking was a paltry 29th place.
Why so high?
California has heavy concentrations of workers in businesses with big seasonal swings – hospitality, agriculture, and retail. Other economically volatile industries, major employers in California, include technology, real estate, and entertainment.
Additionally, California’s celebrated entrepreneurial grit has a downside – that risk-taking creates a higher-than-average failure rate. That can also boost unemployment.
Consider a yardstick for chronic high unemployment from my spreadsheet: How often during the past 48 years has a state’s monthly jobless rate ranked among the nation’s 10 highest?
This is not a Top 10 list to be envied.
- here
Have a news tip for The LA Monitor? Submit your news tip or article here.


